Industry 4.0 · Ankara

Digital transformation isn't a slogan, it's measurable work.Industry 4.0 Solutions

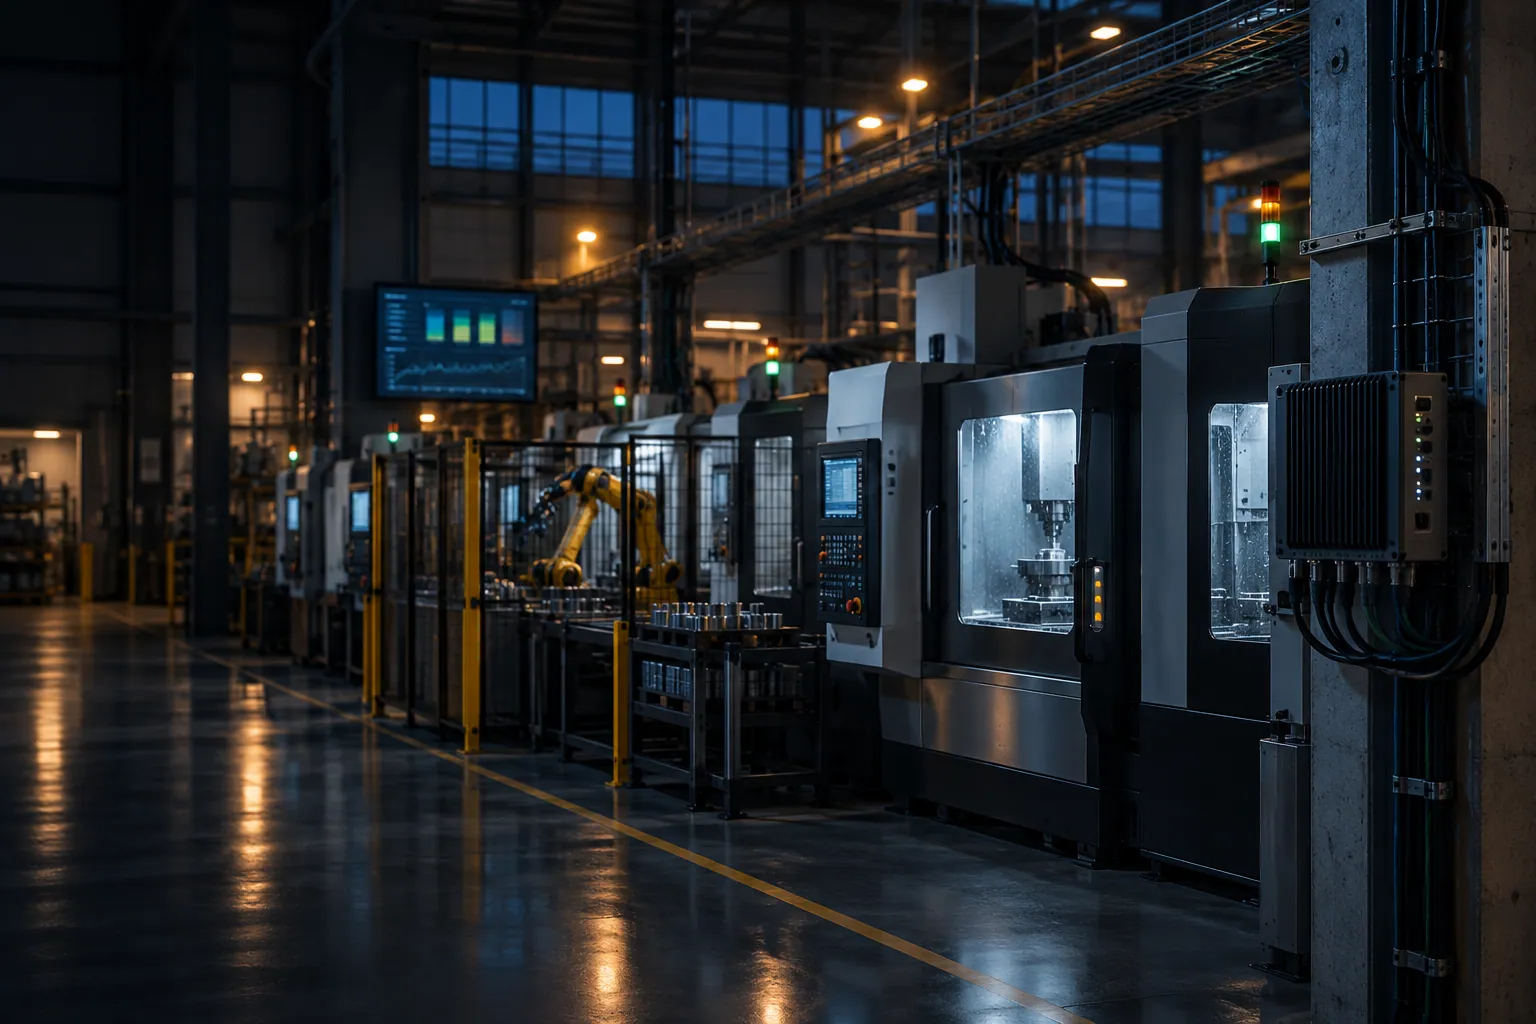
The most common mistake in Industry 4.0 projects is starting everything at once. We start with a single measurable problem: downtime, scrap, energy or traceability.

Data collectionOEE and downtimeEnergy monitoringTraceabilityMES/ERP connectionReporting

Industry 4.0 isn't one product but a few connected capabilities: collecting data from the field, making it meaningful, automating decisions and measuring the result. Projects that try to build all of them at once usually stall within the first six months.

Our approach is the reverse: first we look at which problem can be expressed in money. Unplanned downtime, scrap, energy, or a traceability requirement? One measurable topic is chosen and solved end to end; the next step is built on that result.

If this sounds familiar

  • Digital transformation meetings take place, but nothing changes on the shop floor.
  • Why the line stopped, and for how long, is written from memory at the end of the shift.
  • The energy bill keeps rising, but nobody knows which line or which piece of equipment is consuming it.
  • Tracing the history of a batch during a customer audit takes days.
  • Production data in the ERP doesn't match the shop floor; the two sides quote different numbers.

What it covers

Field data collectionFrom PLCs, meters, sensors and test equipment into a single collection layer. Which data can really be read becomes concrete during discovery.
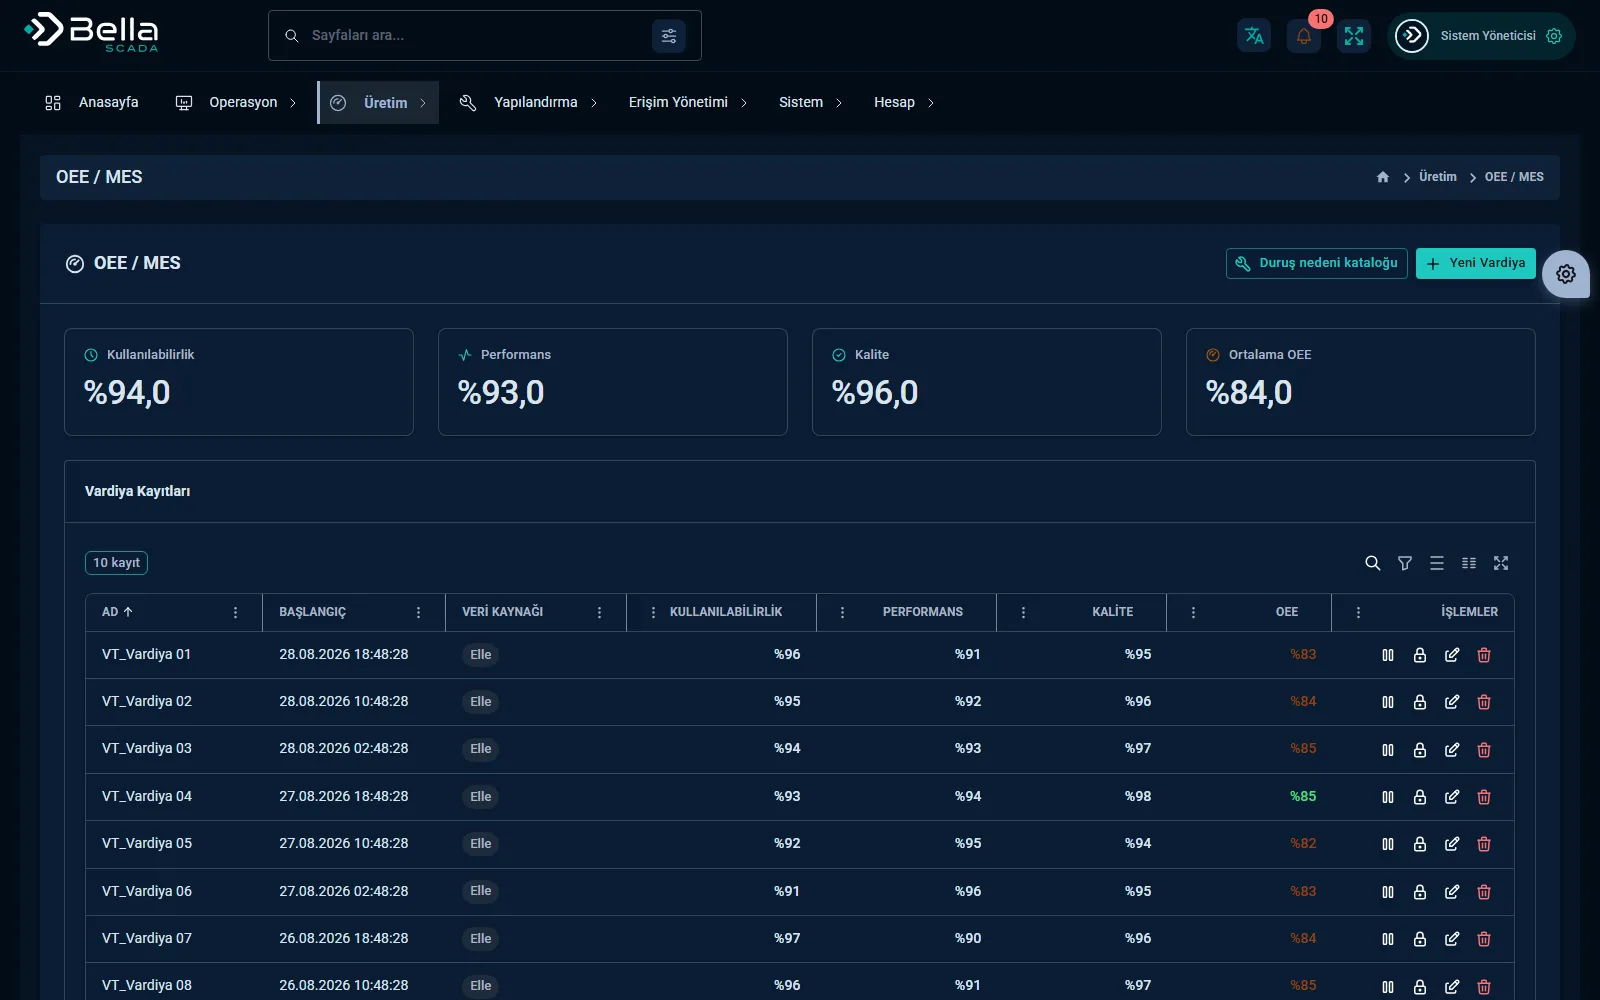
Downtime and OEE trackingShort stops go unrecorded in most plants; five minutes repeated ten times a day eats an hour of the shift. Measure first, then improve.
Energy monitoringConsumption by line, panel or equipment. You can't set a savings target until you can see where the cost arises.
TraceabilityRecording batch, serial number and process parameters. The chain you need for a customer audit or a recall.
ERP and MES integrationData from the field flows into your existing ERP (Netsis, Odoo, etc.) and works both ways with work orders and stock.
Management dashboardOne dashboard broken down by plant, line and equipment. Shift reports are generated automatically; manually prepared spreadsheets are retired.

Example scenarios

Illustrative examples; the specifics are worked out during discovery at your site.

DowntimeMaking short stops visibleStops are captured automatically from the machine's running signal and the operator only picks the reason. The downtime breakdown is ready at the end of the shift.
EnergyEnergy consumption per lineConsumption read from panel meters is matched with production counts; energy per unit is compared by line and by shift.
TraceabilityFrom batch to process parametersThe batch or serial number is stored with the process values at the moment of production and the quality result; lookbacks are done from a single screen.

Bella SCADA screens

Bella SCADA page →
Bella SCADA — Operations dashboard
Operations dashboard
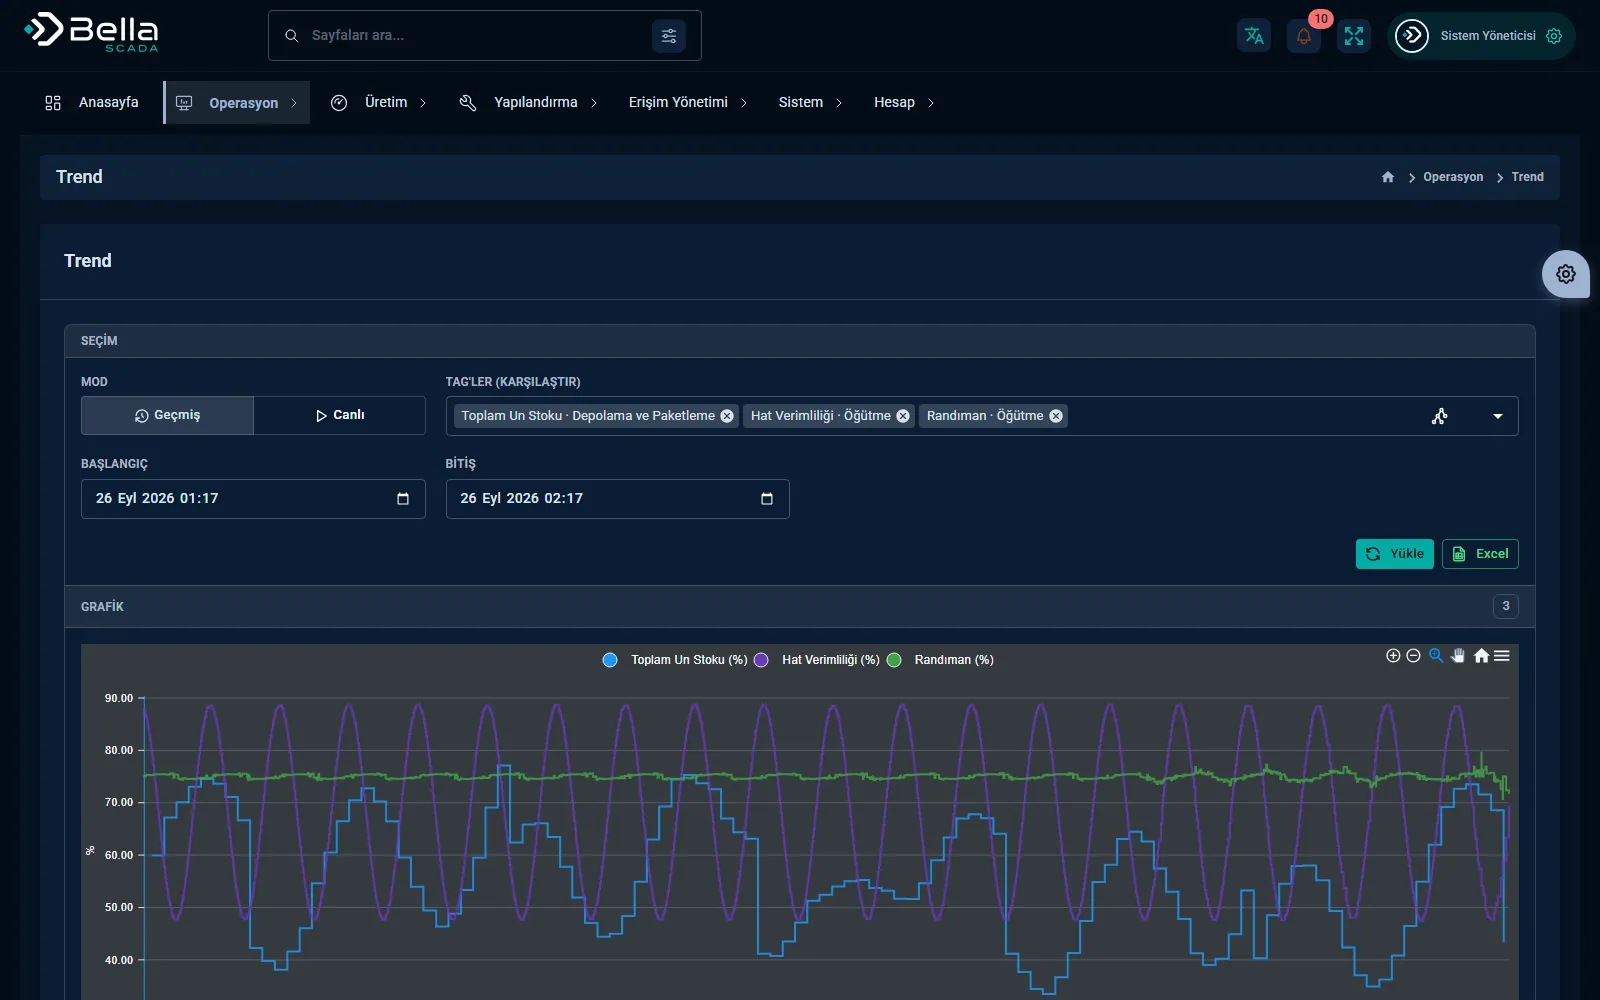
Bella SCADA — Trend charts
Trend charts
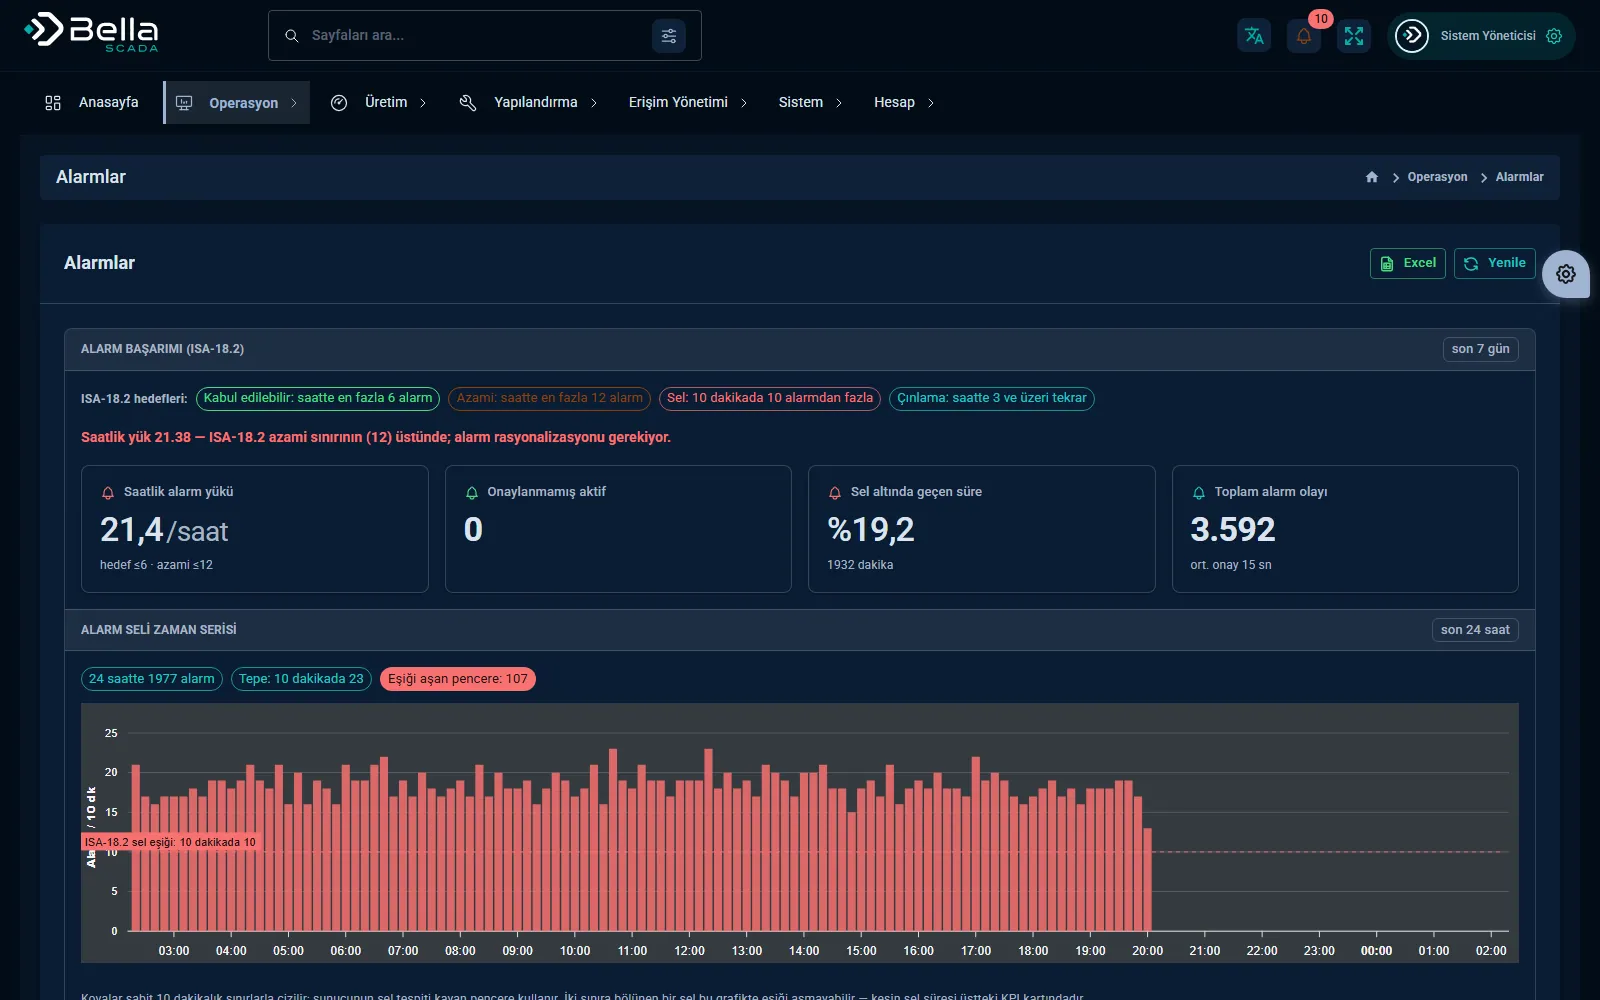
Bella SCADA — Alarm management
Alarm management
Bella SCADA — OEE tracking
OEE tracking

What we deliver

  • Target document defining the selected loss and how it is measured
  • Baseline measured before any improvement
  • Pilot installation collecting data automatically from the floor
  • Management dashboard broken down by plant, line and equipment
  • Transfer flow to the ERP where needed
  • Sequenced roadmap for roll-out

How we proceed

1 · Measurable goalWhich loss we're going after, and how it will be measured, is written down. No project starts with a goal that can't be measured.
2 · Baseline measurementToday's value is recorded before any improvement. Without a baseline, "did it improve?" can't be answered later.
3 · Pilot and validationEnd-to-end installation on one line, with results compared against the field.
4 · RolloutThe validated setup is carried to other lines and plants.

When it's the right choice

  • You have a concrete loss that can be expressed in money: downtime, scrap, energy or audit workload.
  • You are open to starting with one line or plant and expanding once you see the result.
  • The teams on the floor (maintenance, production) can give the project their time.

When it's not the right choice

  • If the goal is a "digital twin" or 3D visualisation to show in a presentation.
  • If no machine signal can be read and there is no budget for hardware — this needs to be discussed first.
  • If everything is expected to change at once through one big programme.

Key products for this industry

Industrial Operations

Bella SCADA

Browser-based real-time monitoring and control for industrial facilities.

MonitoringControlAlarms
OPC UAProtocol
ModbusField connectivity
WebNo client
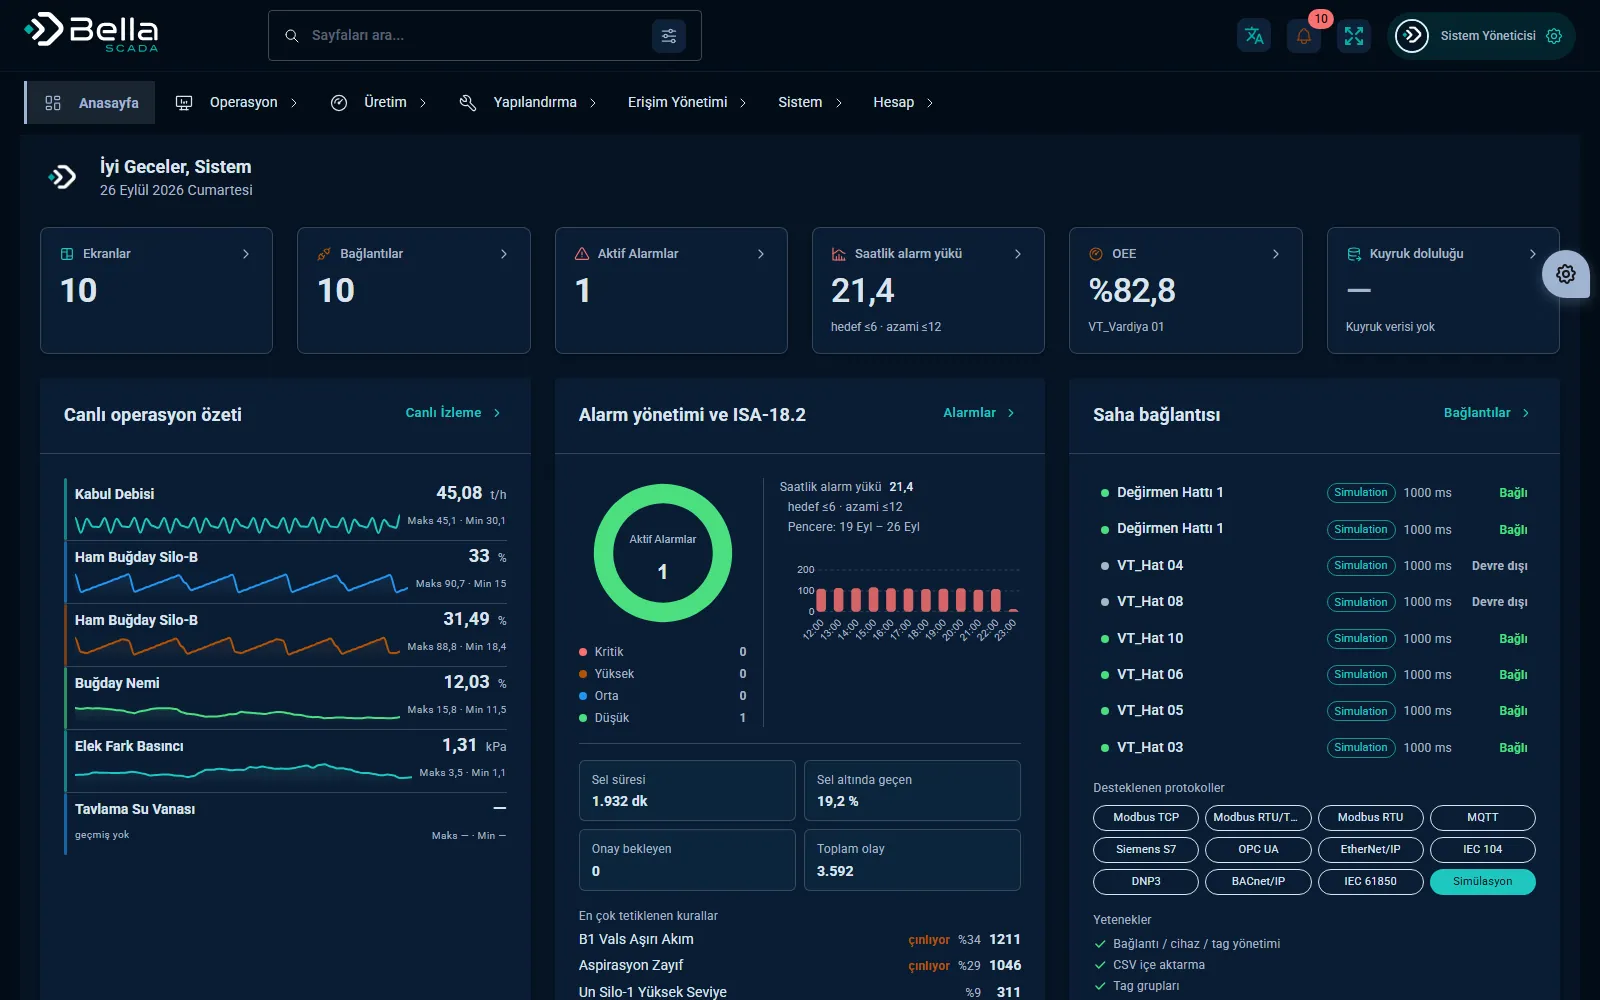
Bella SCADA — screenshot
Maintenance & Asset Management

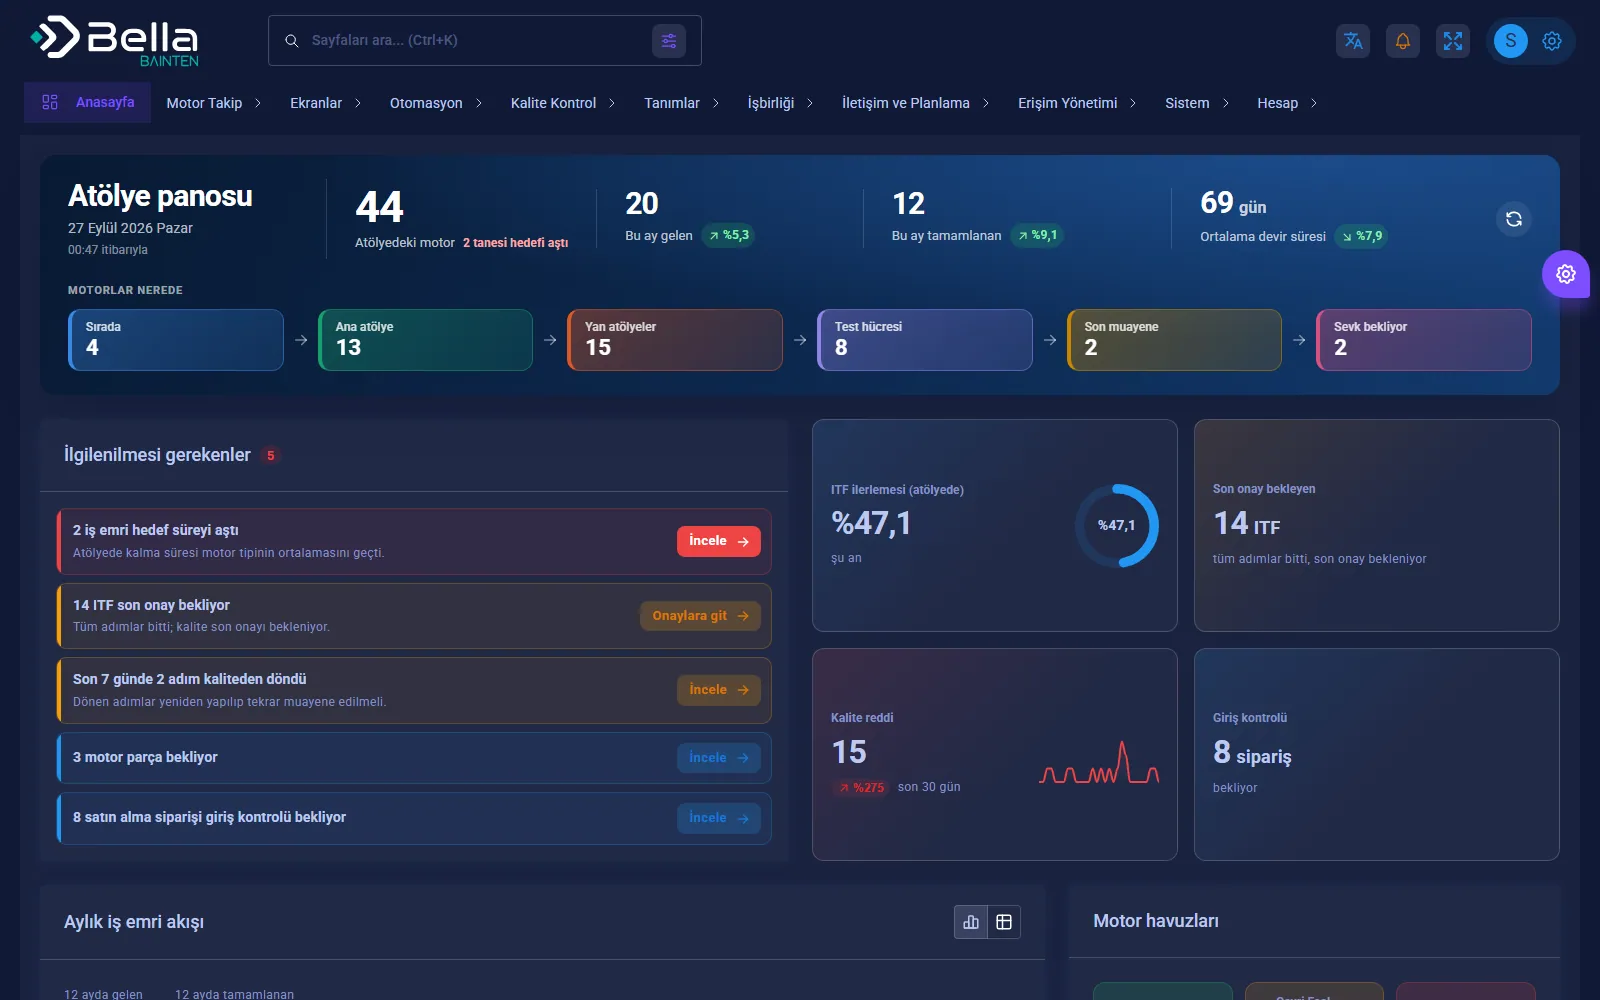
Bainten

Maintenance management that brings equipment, maintenance plans and failure history together in one place.
Maintenance PlanWork OrderAssets
PeriodicMaintenance
MobileField entry
BarcodeAsset tracking
Bainten — screenshot
Data Integration

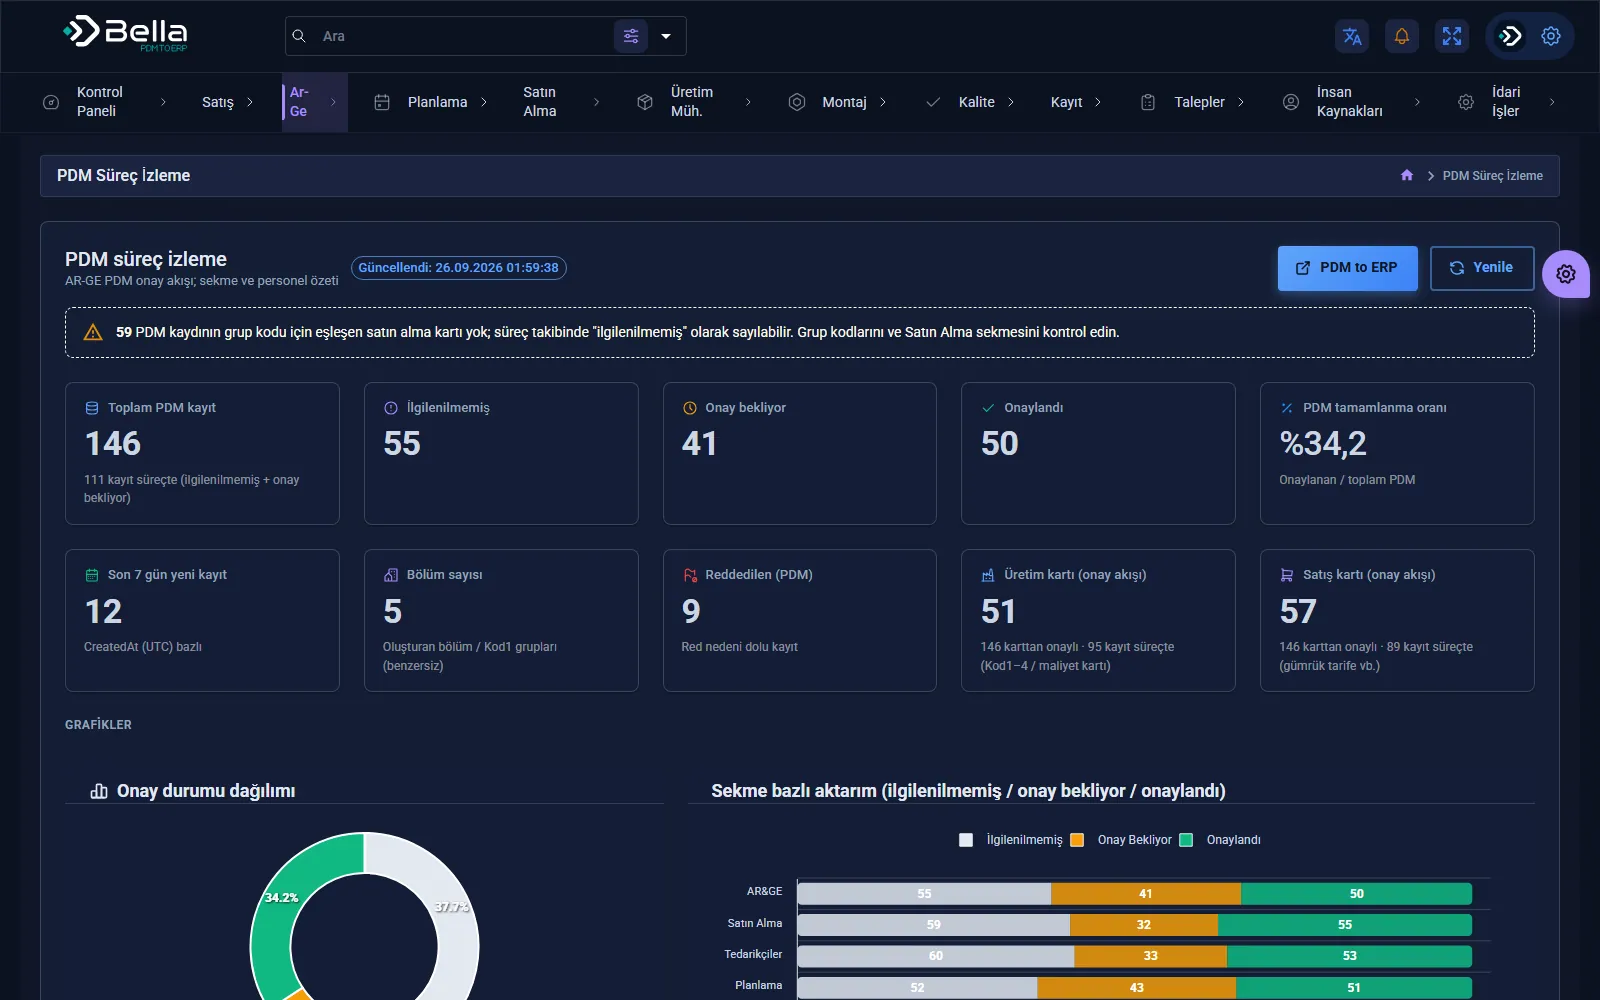
PDM to ERP

A middleware layer that moves the product structure from design into the ERP, rule-based and traceable.
PDM / PLMERPProduct Structure
RulesMapping
RevisionControl
LogTraceability
PDM to ERP — screenshot

Frequently asked

Does it make sense for a small business too?

As long as the scope stays small, yes. Measuring downtime on a single line or putting energy consumption on a dashboard can be done — and pays off — without a big transformation program.

Where should we start?

With a single loss that can be expressed in money. Usually that's unplanned downtime or energy; both are relatively quick to measure and results show up soon.

Will it work with our existing ERP?

We integrate with common ERPs, Netsis and Odoo in particular. For systems without an API, database or file-based transfer can be set up.

Let's talk about this.

We'll listen to your current situation and work out together where to start.